Summary
Overview
The Summary page in the Purple App enables users to analyze work time data for employees across various installation sites. It provides tools to select a specific time range, filter data by employees, installations, and work types, and dynamically display the aggregated results for detailed analysis.
User Interface
This page is structured into two main sections:
- Work Instances Panel (Left Section): Allows users to define the analysis period, select relevant work instances, and apply filters.
- Summary Results (Right Section): Displays aggregated work time statistics for employees and installations.
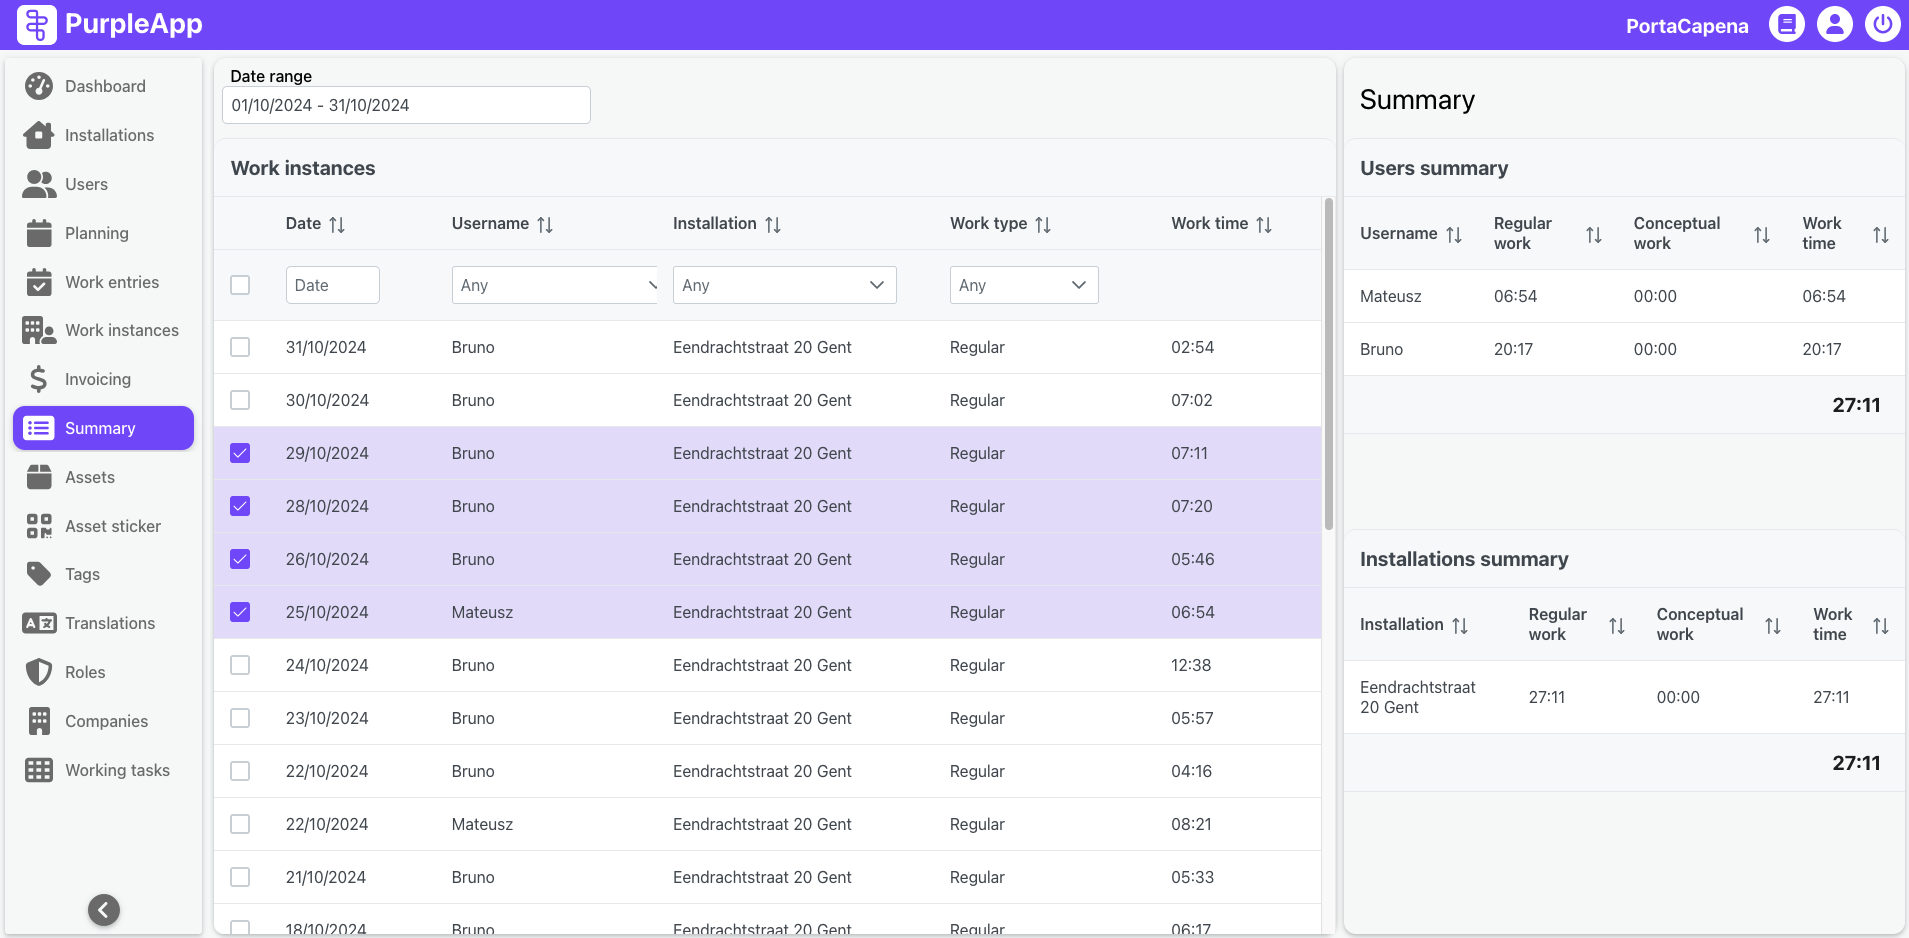
Work Instances Panel (Left Section)
The left section allows users to configure the data for analysis. Key components include:
Date range selector: Specify the start and end dates for the analysis period.
Work instances table: Display a list of all work instances within the defined period. Each row includes the following columns:
- Date: The date of the work instance.
- Username: The employee who completed the work.
- Installation: The location where the work was performed.
- Work Type: The type of work (e.g., Regular or Conceptual).
- Work Time: The duration of the work instance.
Users can select specific work instances by marking checkboxes in the table.
Summary Results (Right Section)
The right section dynamically updates based on the selected work instances and filters. It includes:
Users Summary: Displays aggregated work times per user. Columns include:
- Username.
- Total time spent on Regular work.
- Total time spent on Conceptual work.
- Combined work time.
Installations Summary: Provides an overview of work times per installation. Columns include:
- Installation.
- Total time spent on Regular work.
- Total time spent on Conceptual work.
- Combined work time.
- Overall Totals: Shows the combined total work times for all selected employees and installations.
Use Case Example
An administrator wishes to evaluate the total work time spent by employees at the "Eendrachtstraat 1" installation during October 2024. They:
- Set the date range to 01/10/2024 - 31/10/2024.
- Filter the work instances by Installation: Eendrachtstraat 1.
- View the aggregated results in the Summary Results section.
The results show:
- Total work time for each employee at the selected installation.
- Breakdown of Regular and Conceptual work.